
Research and Data

Power to Decide Data
Interactive Abortion Access Maps
Alongside what should have been the 50th anniversary of Roe v. Wade, Power to Decide's AbortionFinder published interactive maps that provide a compelling illustration of the terrible new chapter for abortion access that’s unfolded over the past year. The maps convey the chaos sparked by the Supreme Court’s decision in Dobbs v. Jackson Women’s Health Organization on June 24, 2022, which rolled back generations of reproductive rights by overturning Roe v. Wade—and now jeopardizes the reproductive rights of generations to come.


Interested in Using Our Data?
Are you interested in using our data for school or work?
We are not able to make the data more broadly available, but we have, in limited instances, made the data available to research partners who intend to analyze it and use it for publication. If you are a researcher interested in using our data for a specific project, please email data@powertodecide.org to request a data use agreement.
Power to Decide Research
Evaluation of an App-Based Sexual Health Intervention
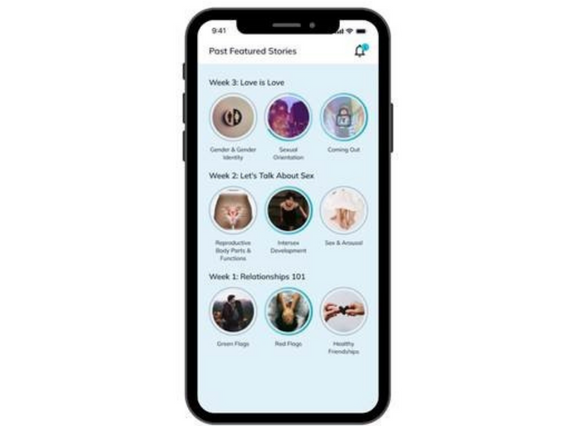
Power to Decide is currently leading a 5-year evaluation of SafeSpace, an app-based intervention that uses authentic youth stories to provide information and resources on sexual health as well as mental and emotional health. Funded by the Administration for Children and Families/Family and Youth Services Bureau’s Personal Responsibility Education Program - Innovative Strategies (PREIS), this project is implemented in partnership with MyHealthEd, Inc., Healthy Teen Network, and Child Trends.
Using a randomized controlled trial, this study is evaluating the efficacy of SafeSpace among adolescents at highest risk of pregnancy, with a focus on youth who identify as LGBTQ+, Black, or Latine. SafeSpace is a 10-week curriculum based on Real Talk, which was originally developed by MyHealthEd as part of Power to Decide’s Innovation Next incubator implemented from 2015-2021. For more details about the evaluation, please see Child Trend’s project web page.
Evaluation of a Contraceptive Clinical Decision Support Intervention
Power to Decide, in partnership with Child Trends, the National Association of Community Health Centers, and University of California San Francisco Beyond the Pill Program, has launched a 5-year project to pilot, implement, and evaluate Let’s Talk Birth Control, a clinical decision support intervention for adolescents that consists of a printed contraceptive decision aid and an online provider training to support contraceptive counseling. Funded by The Office of Population Affairs Teen Pregnancy Prevention Program, the evaluation will enroll 1,500 sexually active adolescents assigned female at birth, who are ages 15-24 and seeking services at community health centers, prioritizing those in states or counties in the United States with teen birth rates higher than the national average. Using a cluster-level randomized controlled trial, this study will test the effectiveness of Let’s Talk Birth Control on contraceptive use and use of preferred contraceptive method. Patient-centered contraceptive counseling will also be examined as a key implementation outcome.
The rigorous evaluation of ‘Let’s Talk Birth Control’ is supported by the Office of Population Affairs of the U.S. Department of Health and Human Services (HHS) as part of a financial assistance award totaling $910,000 with 100 percent funded by OPA/OASH/HHS. The contents are those of the author(s) and do not necessarily represent the official views of, nor an endorsement by, OPA/OASH/HHS or the U.S. Government. For more information, please visit https://opa.hhs.gov/.

Research Initiative on Contraceptive Access
With support from the Arnold Ventures, Power to Decide recently completed an 18-month research initiative with two distinct components that addressed contraceptive access: 1) development of a contraceptive access measurement index that synthesizes existing measures of access; and 2) qualitative data collection with young people addressing their knowledge and preferences related to over-the-counter (OTC) oral contraception. To develop the contraceptive access index, we conducted an environmental scan of existing conceptualizations and measures of access and convened an expert workgroup throughout 2023. The qualitative data collection component of this initiative involved focus groups with young people who face particular barriers to contraceptive access, including Black and Latinx youth, indigenous youth, and youth living in rural areas. Findings from these focus groups are being used to inform the development of materials for young people and pharmacists to support OTC access when it becomes available.
Staff Authored Publications
- Strategies to Develop an LGBTQIA+-Inclusive Adolescent Sexual Health Program Evaluation Frontiers in Reproductive Health Zabryna Balén; Emma Pliskin; Elizabeth Cook; Jennifer Manlove; Riley Steiner; Marisa Cervantes; Milagros Garrido; and Claudia Nuñez-Eddy
- Estimates of Use of Preferred Contraceptive Method in the United States: a Population-Based Study The Lancet Anu Manchikanti Gomez; Ariana H. Bennett; Jennet Arcara; Lisa Stern; Jamie Bardwell; Denicia Cadena; Aisha Chaudhri; Laura Davis; Christine Dehlendorf; Brittni Frederiksen; Catherine Labiran; Raegan McDonald-Mosley; Whitney S. Rice; Tara B. Stein; Ena Suseth Valladares; Megan L. Kavanaugh; Cassondra Marshall
- Addressing Evaluation Barriers with Early Innovation Development for Adolescent-Focused Sexual and Reproductive Health Interventions Prevention Science Kelly L. Wilson; Sarah Axelson; Whitney R. Garney; Kristen M. Garcia; Katy Suellentrop; Christi H. Esquivel
- Characteristics of U.S. Abortion Patients Who Obtained Care Out of State Prior to the Overturning of Roe v. Wade Womens Health Issues Sarah M Axelson; Riley J Steiner; Rachel K Jones
- Catalyzing Technology-Based Innovation in Teen Pregnancy Prevention: an Implementation Model and Findings from a Human-Centered Design Initiative Prevention Science Jill Antonishak; Katy Sullentrop; Riley J. Steiner; Laura Lloyd; Sarah M. Axelson
- Over-the-Counter Oral Contraception in the United States: An Important Opportunity at a Time of Increased Concern About Contraceptive Access Contraception Riley J.Steiner MPH, PhD and Raegan McDonald-Mosley, MD, MPH
- Reproductive Well-Being: A Framework for Expanding Contraceptive Access American Journal of Public Health Sarah M. Axelson, MSW; Gillian A. Sealy, PhD, MPH; and Raegan E. McDonald-Mosley, MD, MPH
- Pregnancy Intention Screening in Patients With Systemic Rheumatic Diseases: Pilot Testing a Standardized Assessment Tool ACR Open Rheumatology Katherine P. Pryor; Bill Albert; Sonali Desai; Susan Y. Ritter; Laura Tarter; Jonathan Coblyn; Bonnie L. Bermas; Leah M. Santacroce; Caryn Dutton; Kari P. Braaten; Lydia E. Pace; Kathryn Rexrode; Elizabeth Janiak; and Candace H. Feldman
- Teen Pregnancy Prevention Programs: A Tale of Persistence Bipartisan Policy Center Andrea Kane; Rachel Fey; G. William Hoagland
- The Trump Administration Deals a Blow to Evidence-Based Policy Evidence-Based Policymaking Collaborative Ron Haskins and Andrea Kane
Other Resources


Outside Sources to Learn From
Contraceptive Use (Data from the CDC's National Survey of Family Growth)
- Nearly all women (99% of those age 15-49) who have ever had sexual intercourse have used contraception in their lifetime. A snapshot in time of contraceptive use shows that 65% of women aged 15-49 were using contraception in 2017-2019.
- The most used methods of contraception among women aged 15-49 between 2017 and 2019 include female sterilization (18%), the pill (14%), the IUD or implant (10%), male condom (8%), male sterilization (6%), withdrawal (4%), Depo-Provera (2%), calendar/rhythm (1.4%), and natural family planning (0.3%). About one-third (35%) say they are not currently using contraception.
Abortion (Data from the Guttmacher Institute)
- There were more than one million estimated abortions in the US in 2023. That is a 10% increase since 2020.
- Medication abortions now represent more than six in ten (63%) of all abortions in the US. That is a 53% increase from 2020.
Births (Data from the National Center for Health Statistics)
- The number of births in the US was essentially unchanged between 2021 and 2023. As a general matter, birth rates have decreased for younger women and increased for older women in the past decade plus.
- The teen birth rate has declined 78% since peaking in 1991, including a 2% decline between 2021 and 2022.
- Birth rates for women aged 20-24 have decreased 43% between 2007 and 2022.